
This is a simple tool that generates graph-based diagrams depicting the n-gram coverage of textual corpora (where n=1, 2, or 3). If the corpus is representative for the domain, the total number of unique observations will stabilize after a while.
The example below analyses a tiny corpus consisting of 48 daily Australian weather forecasts taken from this URL. The corpus consists of 29456 words, 531 unique words (unigrams, Fig.1), 4575 unique word pairs (bigrams, Fig.2), and 9605 unique word triplets (trigrams, Fig.3). Though all three graphs are well beyond the worst case (where each new n-gram encountered in the running text is unique), they clearly indicate that the corpus only allows for unigram-modeling. The graph in Fig.1 is the only one showing a clear stabilizing tendency.
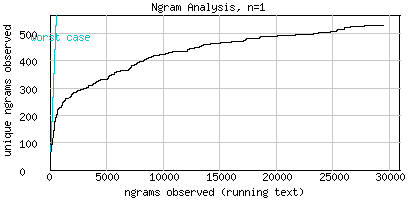
Fig.1 Acceptable unigram coverage: 29456 n-grams, 531 unique n-grams, n=1 (no stemming)
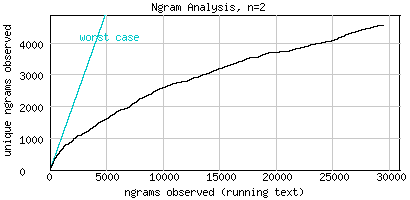
Fig.2 Bad bigram coverage: 29456 n-grams, 4574 unique n-grams, n=2 (no stemming)
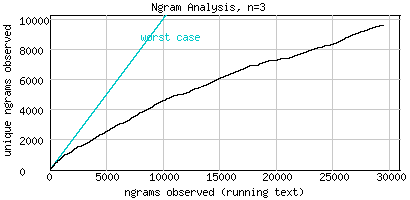
Fig.3 Horrible trigram coverage: 29456 n-grams, 9603 unique n-grams, n=3 (no stemming)
Stemming (where word forms are clustered to stems, se helppage about the docclassifier) can in some cases reveal how much further data is needed for an acceptable n-gram coverage, however in the example described above this is not the case. To experiment with the corpus yourself, you can copy the URI http://tom.brondsted.dk/ngram/weather.txt into the form on the upload page.